
Analytics is needed to make data-driven business decisions. It isn’t just reports as many used to think. It gives you a full picture of your field service performance as well as the ability to track geographically the frequency of deliveries and orders in a certain area on a map. Perhaps in some distant area your delivery services are systematically late, or a particular driver is ineffective compared to others. Thus, analytics can help you understand what drives your organization’s success.
Using the Relog route planning software analytics module as an example, we will study two tools - Analytics on web app (app.relog) and Relog BI. App.relog analytics tool was designed to eliminate the complications of planning your field service work by analyzing drivers' KPI, which customers bring your company more profit and the delivery level service. The tool contains nine types of reports, let's take a look at some of them.
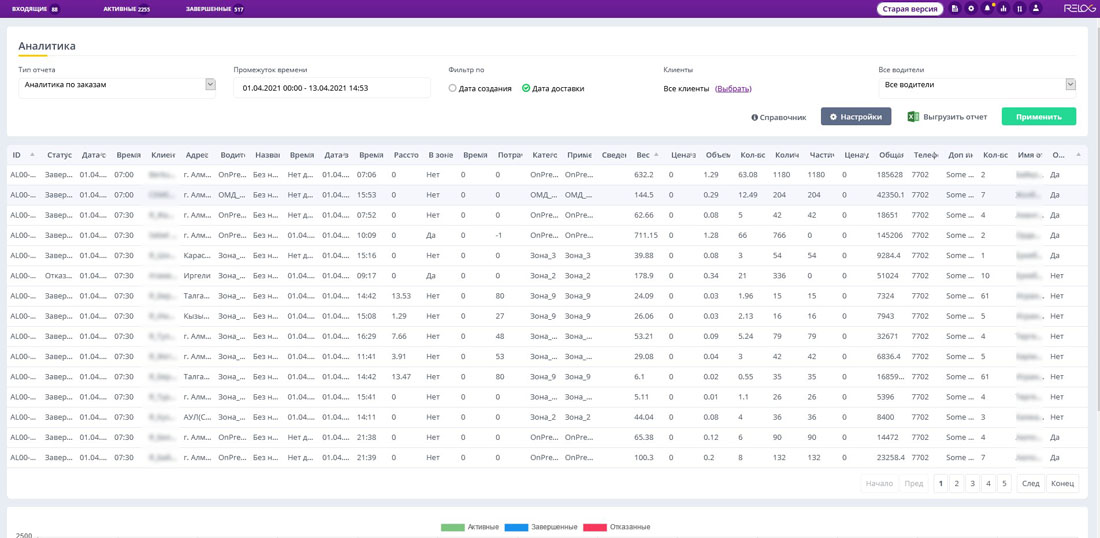
1. Analytics on orders
This report allows you to view all information on order in the required time period, starting from the delivery date and the client's name, to the time spent for the delivery of order. The option can track drivers in real time. Also, it determines your most loyal customers, and those for whom shipping costs exceed the amount of delivery for a given period.
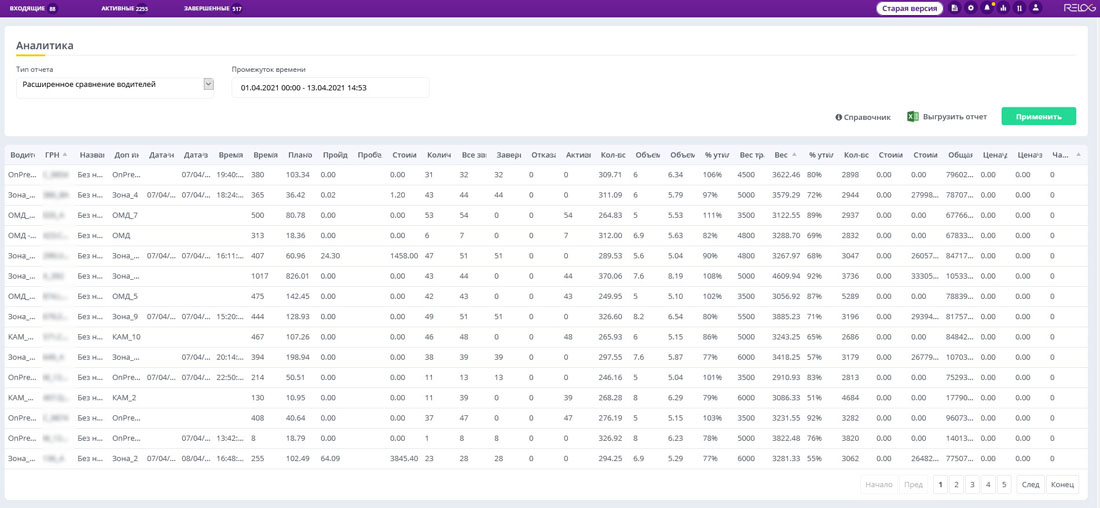
2. Advanced drivers’ comparison
ADC gives you data on each driver for the selected period. ADC shows the driver’s efficiency and how many orders he delivered per day. ADC can automatically accomplish tasks such as driver behavior monitoring, vehicle diagnostics and display of the longest and shortest routes.
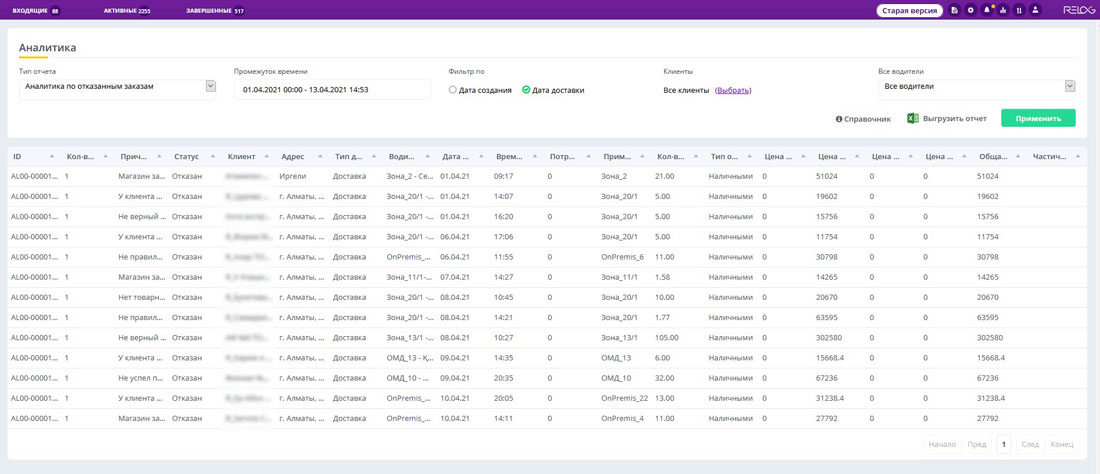
3. Analytics for refused orders
Analytics for refused orders represents all the data on rejections and returns. The service helps to find out what was the reason for rejection, which customers make a return most often, and if the rejection occurs due to the driver's delay, the report identifies which driver was late.
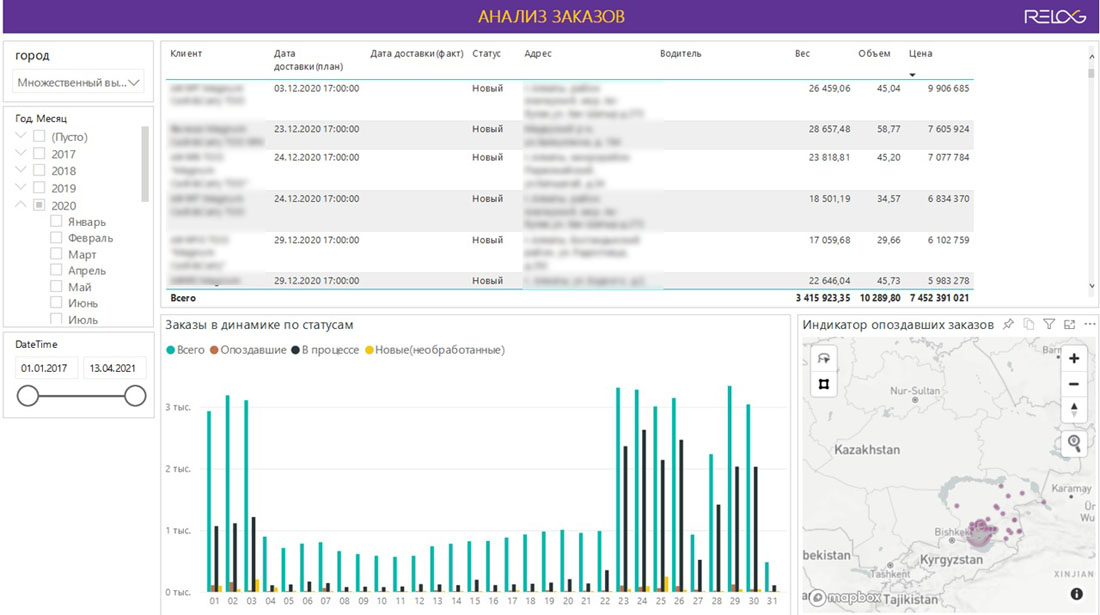
RELOG BI
Now let's talk about Relog BI, where analytics is configured individually depending on the client’s needs. Relog BI makes it possible to compare different periods or branches on a very simple, intuitive and native dashboard where all data displayed in a variety of graphs and maps. With Relog BI tool you can identify weaknesses and eliminate them.
Let's look at the Relog BI analytics main modules:
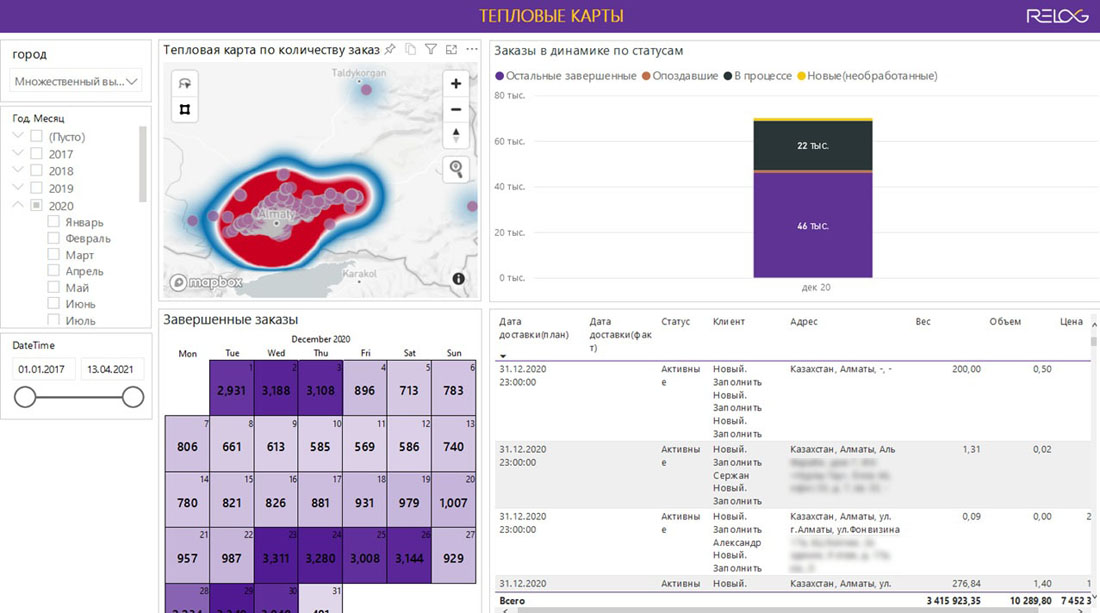
1. Analysis of orders
A. Number of orders’ heatmap
This module displays the number of orders, frequency of orders and deliveries on the Heat Map.
B. Completed orders calendar
Completed orders calendar gives you an opportunity to track profitable or unprofitable days in terms of completed orders number and thereby to allocate resources correctly.
C. Late orders indicator
Late orders indicator allows you to see all the data on driver’s delivery delay and take measures to eliminate delays in the future.
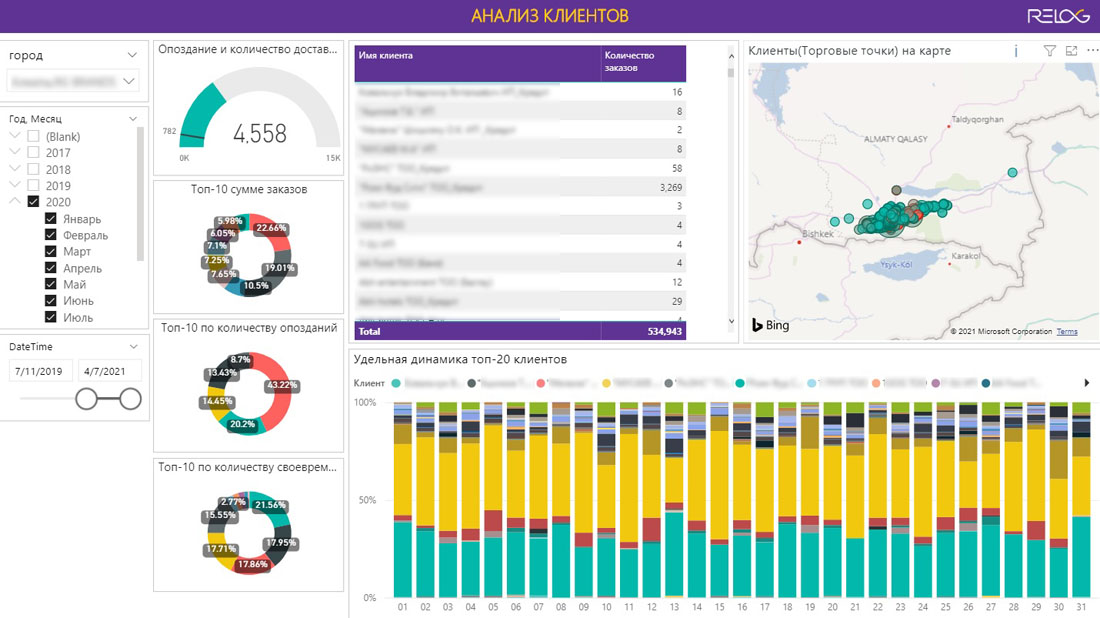
2. Customer analysis
You can study all the data on customers in aggregate and in particular within the customer analysis. Each customer’s location displayed on the map, how many requests the client makes, was the driver’s delivery on time or delayed. And it shows the amount of payments for orders made by a particular customer.
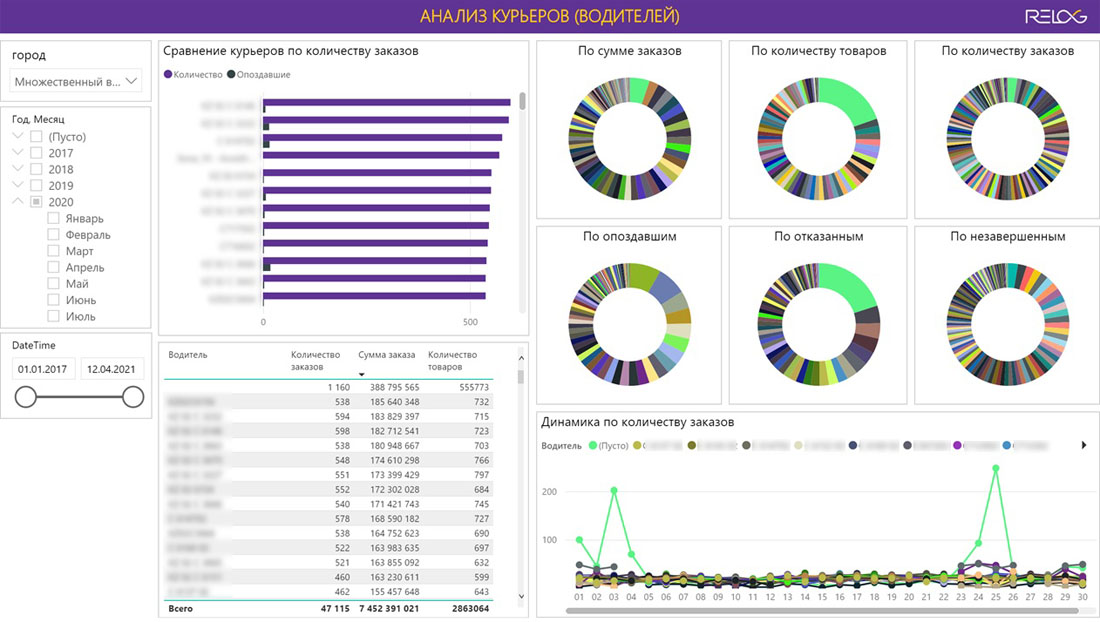
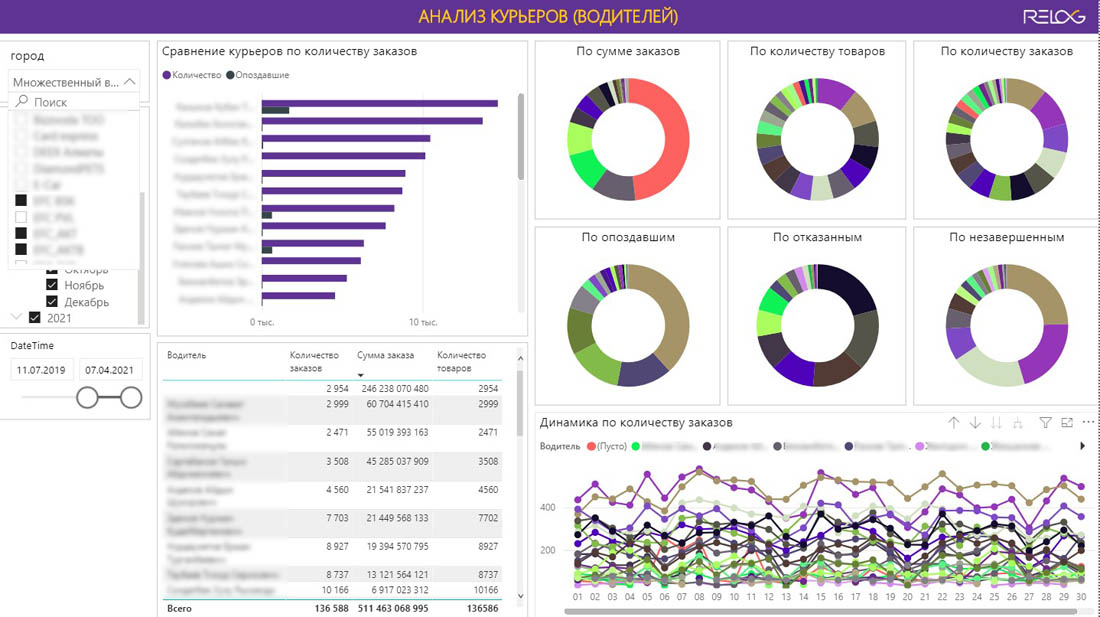
3. Couriers analysis
The module allows you to carry out a comparative analysis of couriers’ KPI. You can see all the data on the personnel delivering products performance and their ratings based on customers’ reviews. Using the couriers’ analysis, you easily see drivers who needs to be fired or rewarded.
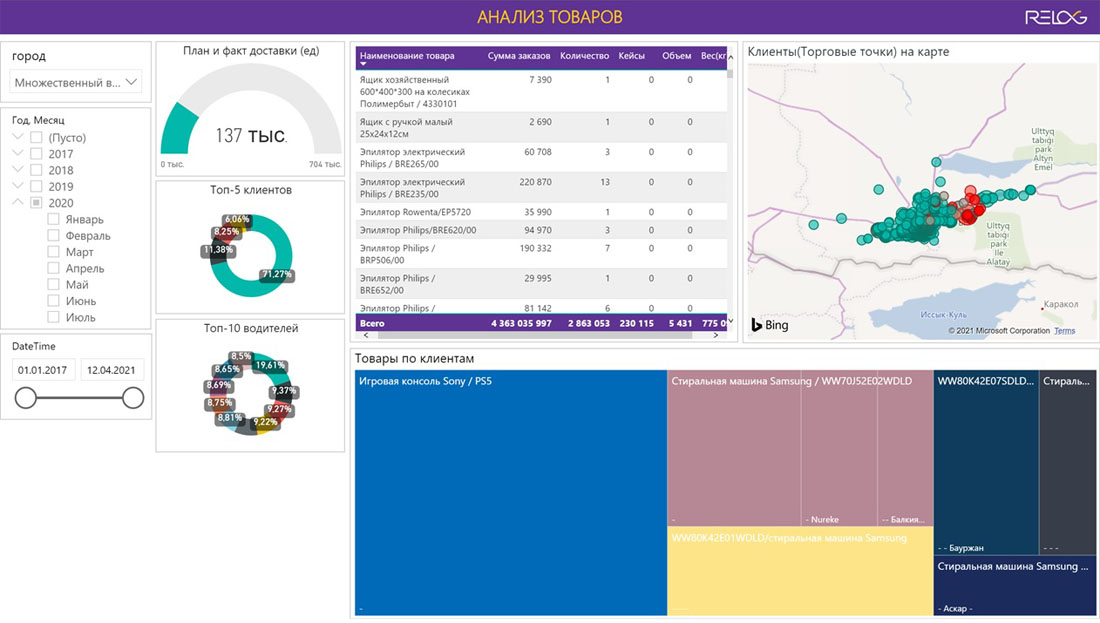
3. Analysis of goods
This analytics module reveals what the most popular product is delivered in a given time period, to which points on the map these products are delivered, by which drivers and how successfully.
4. Comparison of branches.
If you have several branches, Relog BI can become an indispensable resource of information, since all data will be collected and formed in the required form automatically, and you will have the opportunity to view the work of one, several or even all branches at once.
Conclusion.
We have shown you only a part of the reports, according to which you can see the whole picture of your logistics work in real time. It is beyond doubt that route planning software which focuses only on routing and control is only half the benefit. Without competent and detailed analytics, it is difficult to "patch up holes" and bring logistics processes into an economically profitable channel quickly. With Relog route planning software you won't have such problems. We are waiting for your requests!