Companies that are confidently moving towards success today don't have much time to improve their business processes – there are too many challenges, globalization and, as a result, the lack of trade borders, growing or already high competition. Real-time data analytics allows companies in any industry to go beyond the meager reports, "be aware" of hidden problems in all aspects and turn them into growth points for themselves. Using the example of Relog BI analytics, we analyzed which information panels (dashboards) are most in demand among distributors, FMCG companies, online stores, food, building materials, furniture, and other producers, and why.
To begin with, it is worth explaining: the choice for this review fell on Relog BI for several reasons. This is a very flexible and comprehensive tool that provides complete and timely data. In addition, it allows to compare different periods of operation of the company, its regional representative offices, and diagrams and maps make it easy to assimilate information. But the biggest value is that Relog BI is customizable depending on the company's needs.
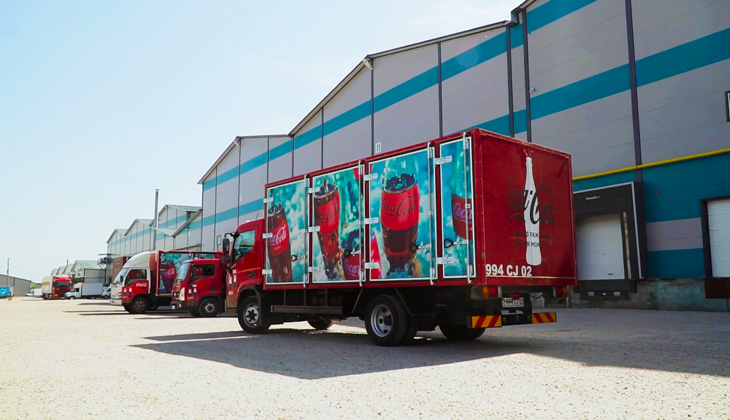
Thus, according to our data scientists, in the first place in terms of the level of demand for companies is drivers' analytics, and this is just a storehouse of important data.
The program monitors the work of couriers for any selected period – year, month, week, day - for completed deliveries. You can identify both top drivers and outsiders, and the report will be created in the visually convenient form on the descending principle.
You can compare specific drivers with each other and also with the help of a clear, beautiful diagram. Or find out which of the couriers had the largest receipt in different periods.
In order to put logistics in order, the ranking of couriers for undelivered goods will help a lot. By the way, the program has an indicator – backlog, or the client's refusal of the delivery due to the driver's fault and which he still has to deliver. Until he does this, he's left with a missed assignment, so to speak. And the backlog, among other factors, affects the driver's KPIs, which forms his salary.
In general, you can get a complete picture for each driver: the date of creation of the delivery order, when he actually served each of the orders, in what order he did it, the total weight of the goods in his car and their gross amount.
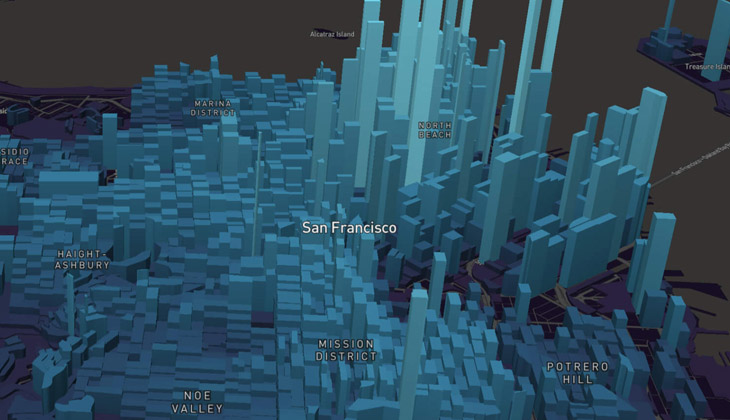
Second – heat maps. This smart report will show in which areas of the city the company actively delivers its goods, and where it should push up to expand the circle of clients.
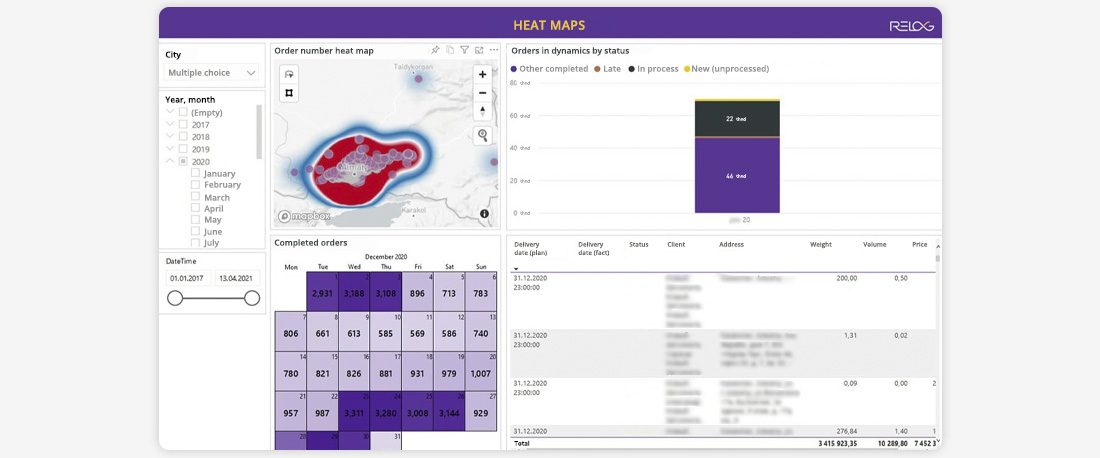 Perhaps it simply doesn't know that new stores have opened in some part of the city to offer its goods.
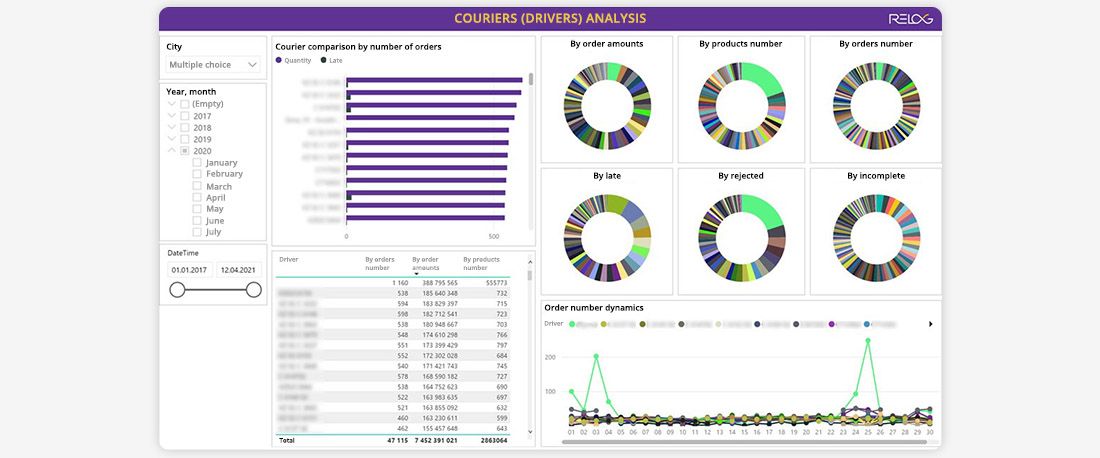
Third – order analytics. How many orders did each driver complete, for example, in a day? How many are being processed? And what his orders were refused by the client? All this and much more can be found out in real time and the information will be updated automatically.
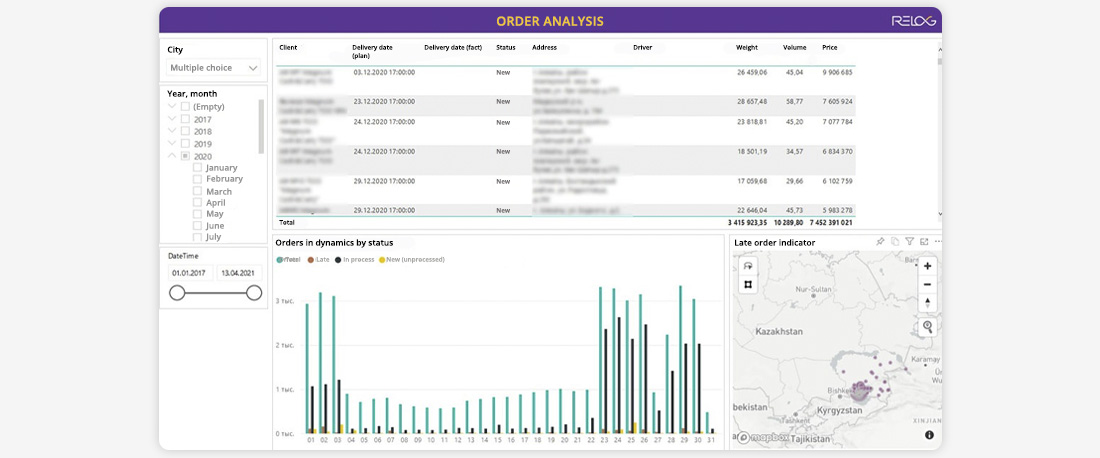
By the way, the reasons for client refusals can be found by comparing to drivers' delays, maybe this is the reason why some of the buyers did not accept the order, but there is a possibility that the goods arrived in the improper form (here you will find the client service, which allows you to take pictures of the goods upon receipt).
Fourth – client analytics. With this report, you can find out which of them made orders most often, and who ordered for the largest amounts in any time period of interest, as well as on which days the clients were most active.
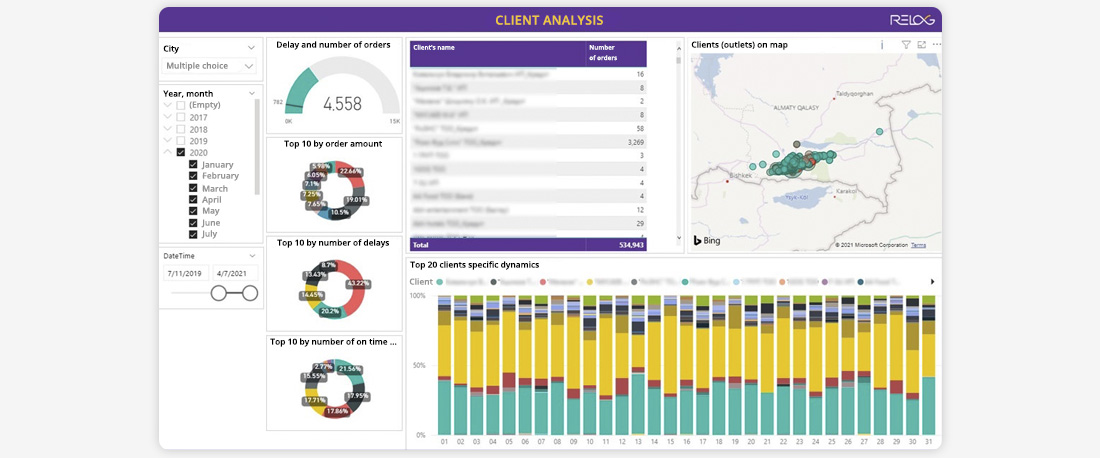
Client classification will help create loyalty programs or offer bonuses to loyal clients.
Fifth place - product analytics. It helps to quickly and regularly identify the top positions and, conversely, those that are practically not in demand.
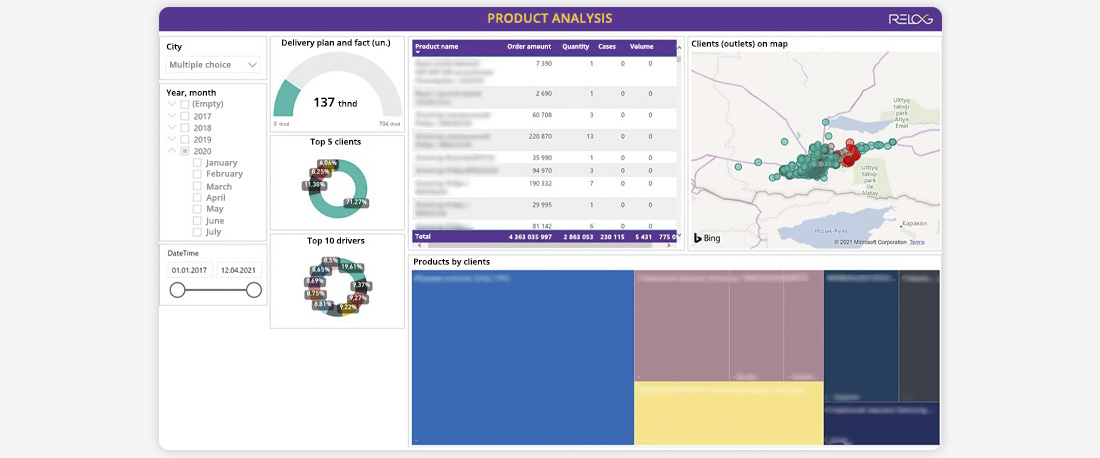 You can also find out what products the most active clients buy and for what amount, and then inform them about new products, and hold interesting promotions for not very popular SKUs. In addition, Relog BI allows to determine which goods were carried by the driver with the largest receipt, since each has its own geofence of delivery, and then some area of the city may have its own popular goods. A very interesting option is the analytics on products sold against the background of planned sales.
Of course, this is not all information about the analytics capabilities, Relog has all the formulas that can calculate additional logistics parameters necessary for the client.